Arts, Activism, Policy, Power: Folded Map
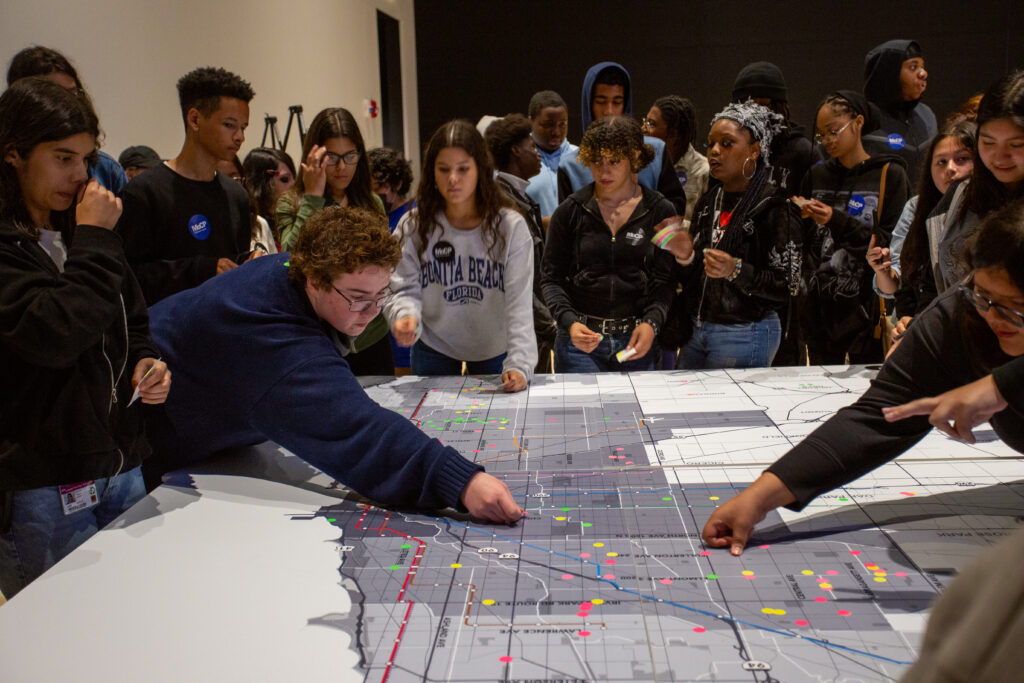
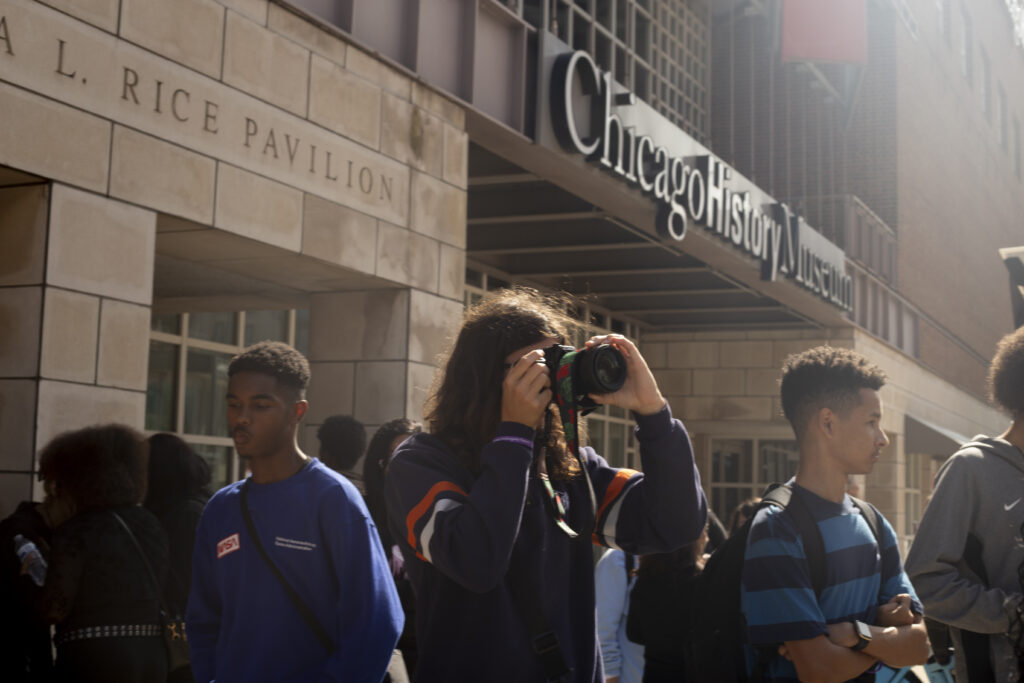
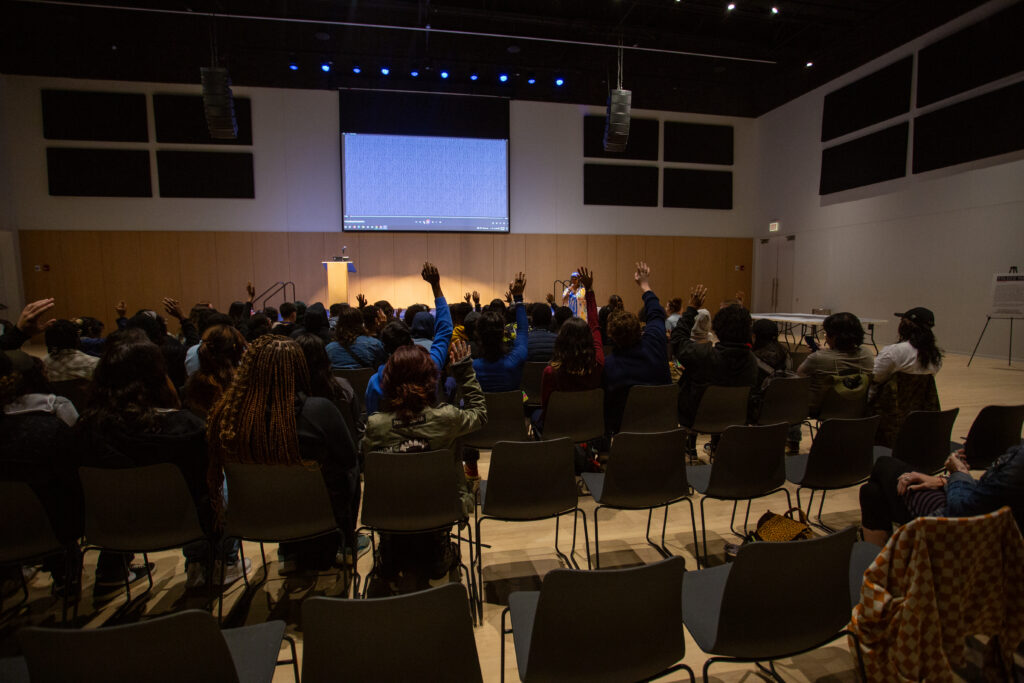
Arts, Activism, Policy, Power is a program that connects the MoCP’s exhibitions, visiting artists, and collections with local high school students to help them discover how artist activists create change in their communities. In Fall 2023, students from three Chicago Public Schools (Prosser Career Academy, Lincoln Park High School, and Kenwood Academy) worked with Chicago-based social justice artist Tonika Lewis Johnson and her Folded Map Project. The resources from this program have been adapted here to use by educators in their own classrooms.
This is the link to the digital exhibition.
Image Gallery

About the Folded Map Project:
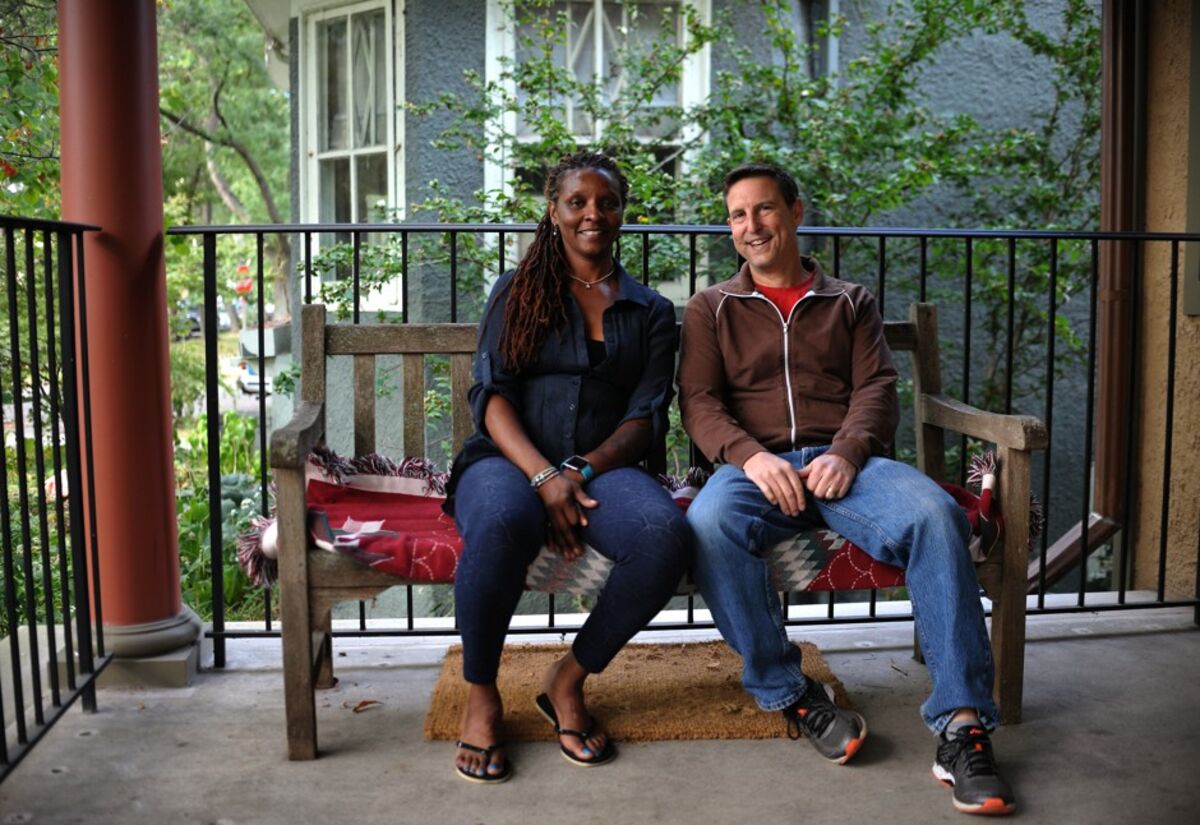
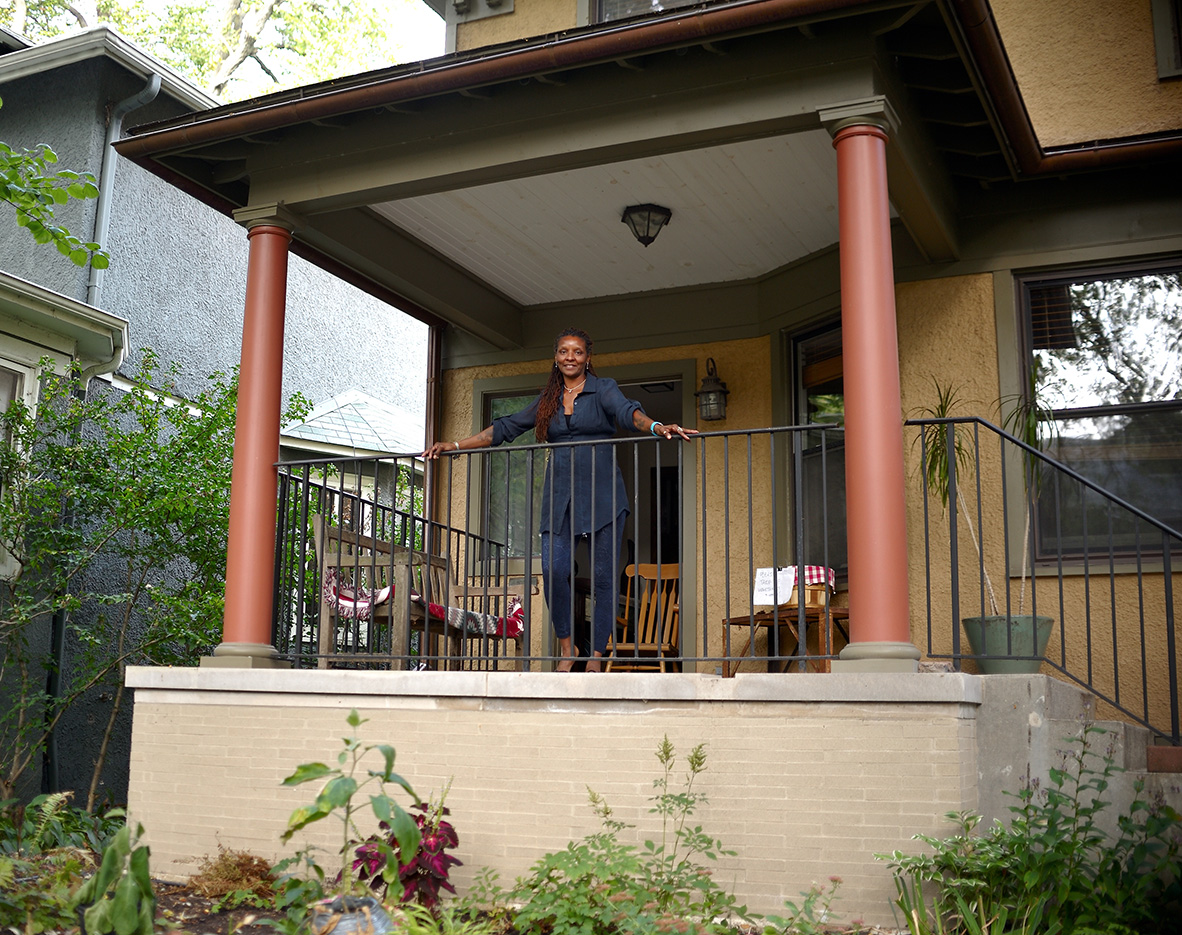
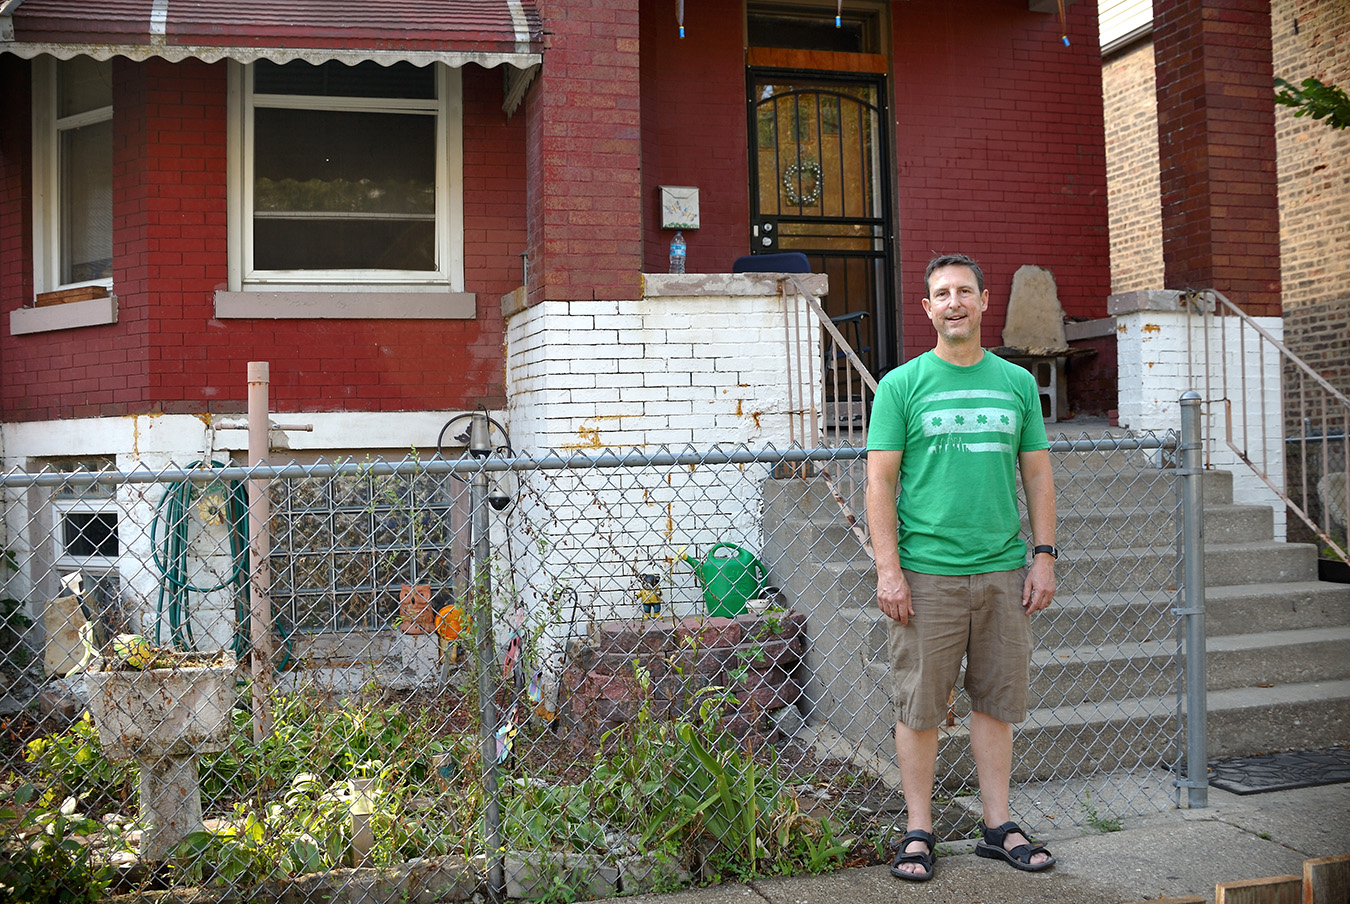
Tonika Lewis Johnson started the Folded Map Project in 2017 to connect people in disparate parts of the city to one another as a way to shed light on the systems of segregation that keep people separated. Her project idea is straightforward: she takes one address and, using Chicago’s gridded map system, finds its “twin” on the other side of the map. For example, the map twin to 5300 N. Western Avenue is 5300 S. Western Avenue. Johnson introduces the residents of the two addresses to one another and documents their exchanges in photography and video. The resulting images are compiled into a comprehensive and interactive website that you can view here.
Watch WTTW Chicago Tonight coverage on Folded Map here.
ART
Closely read the images in Johnson’s project
Image Gallery
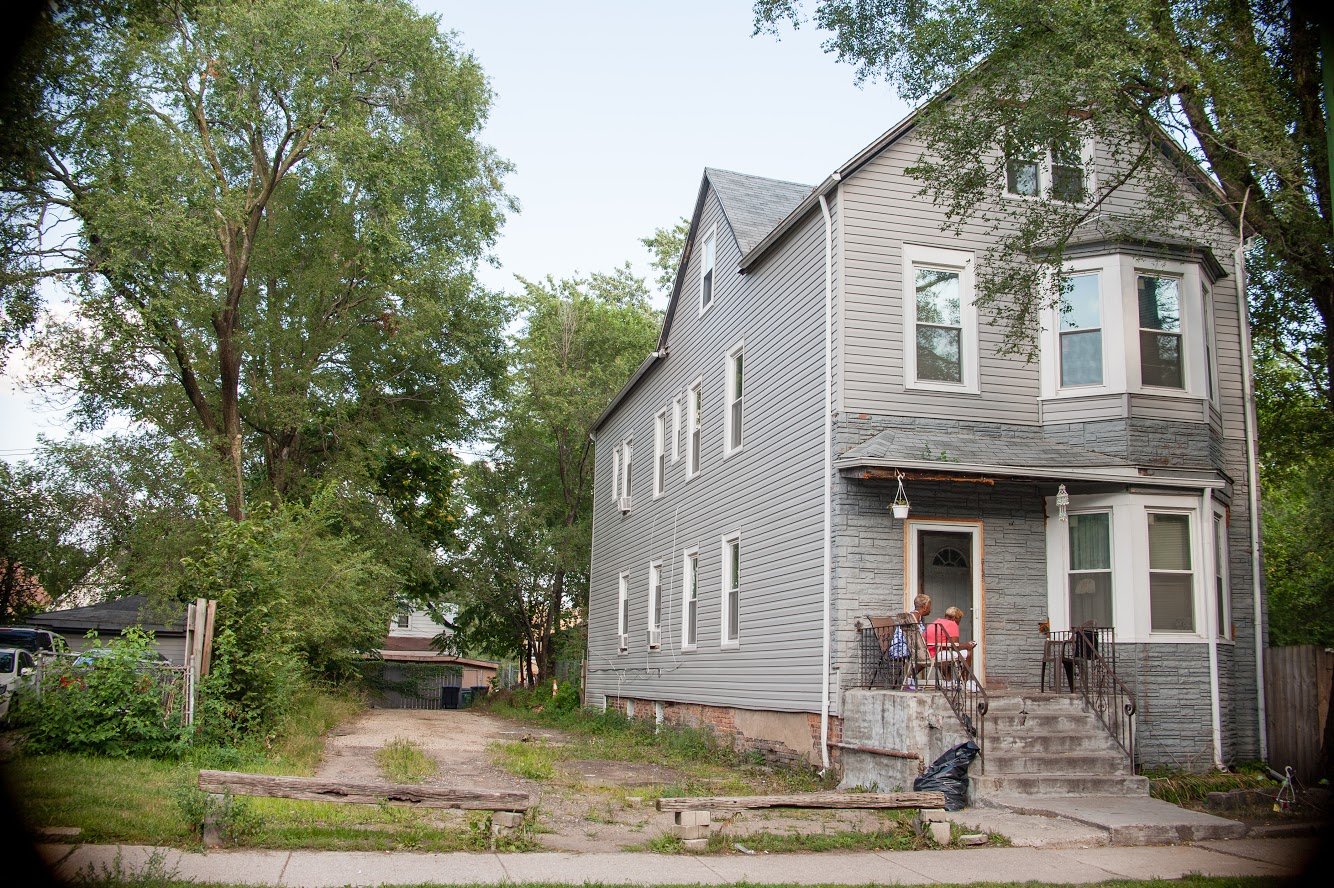
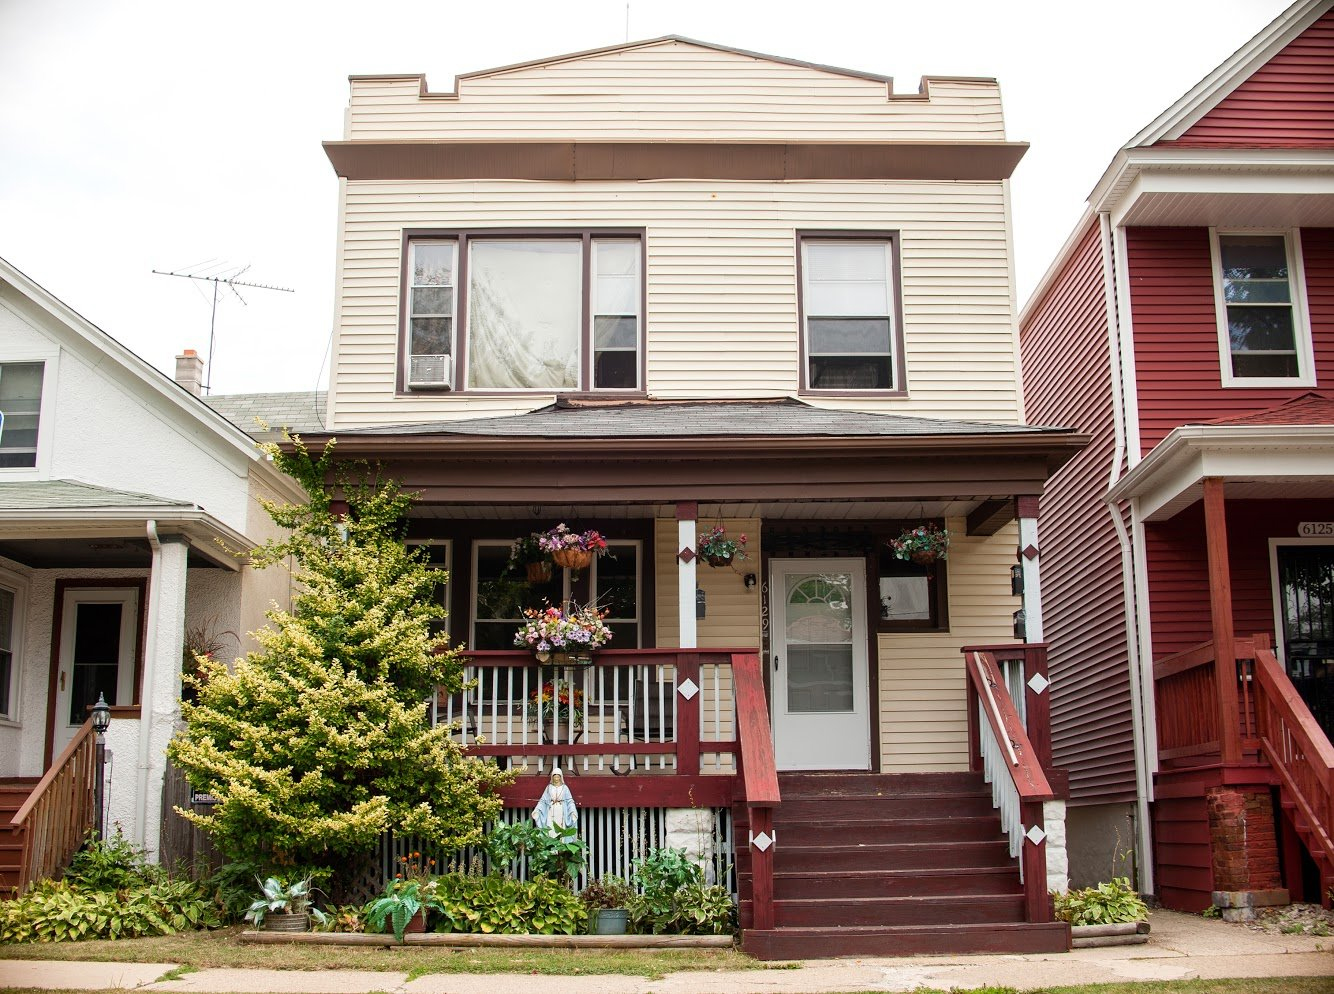
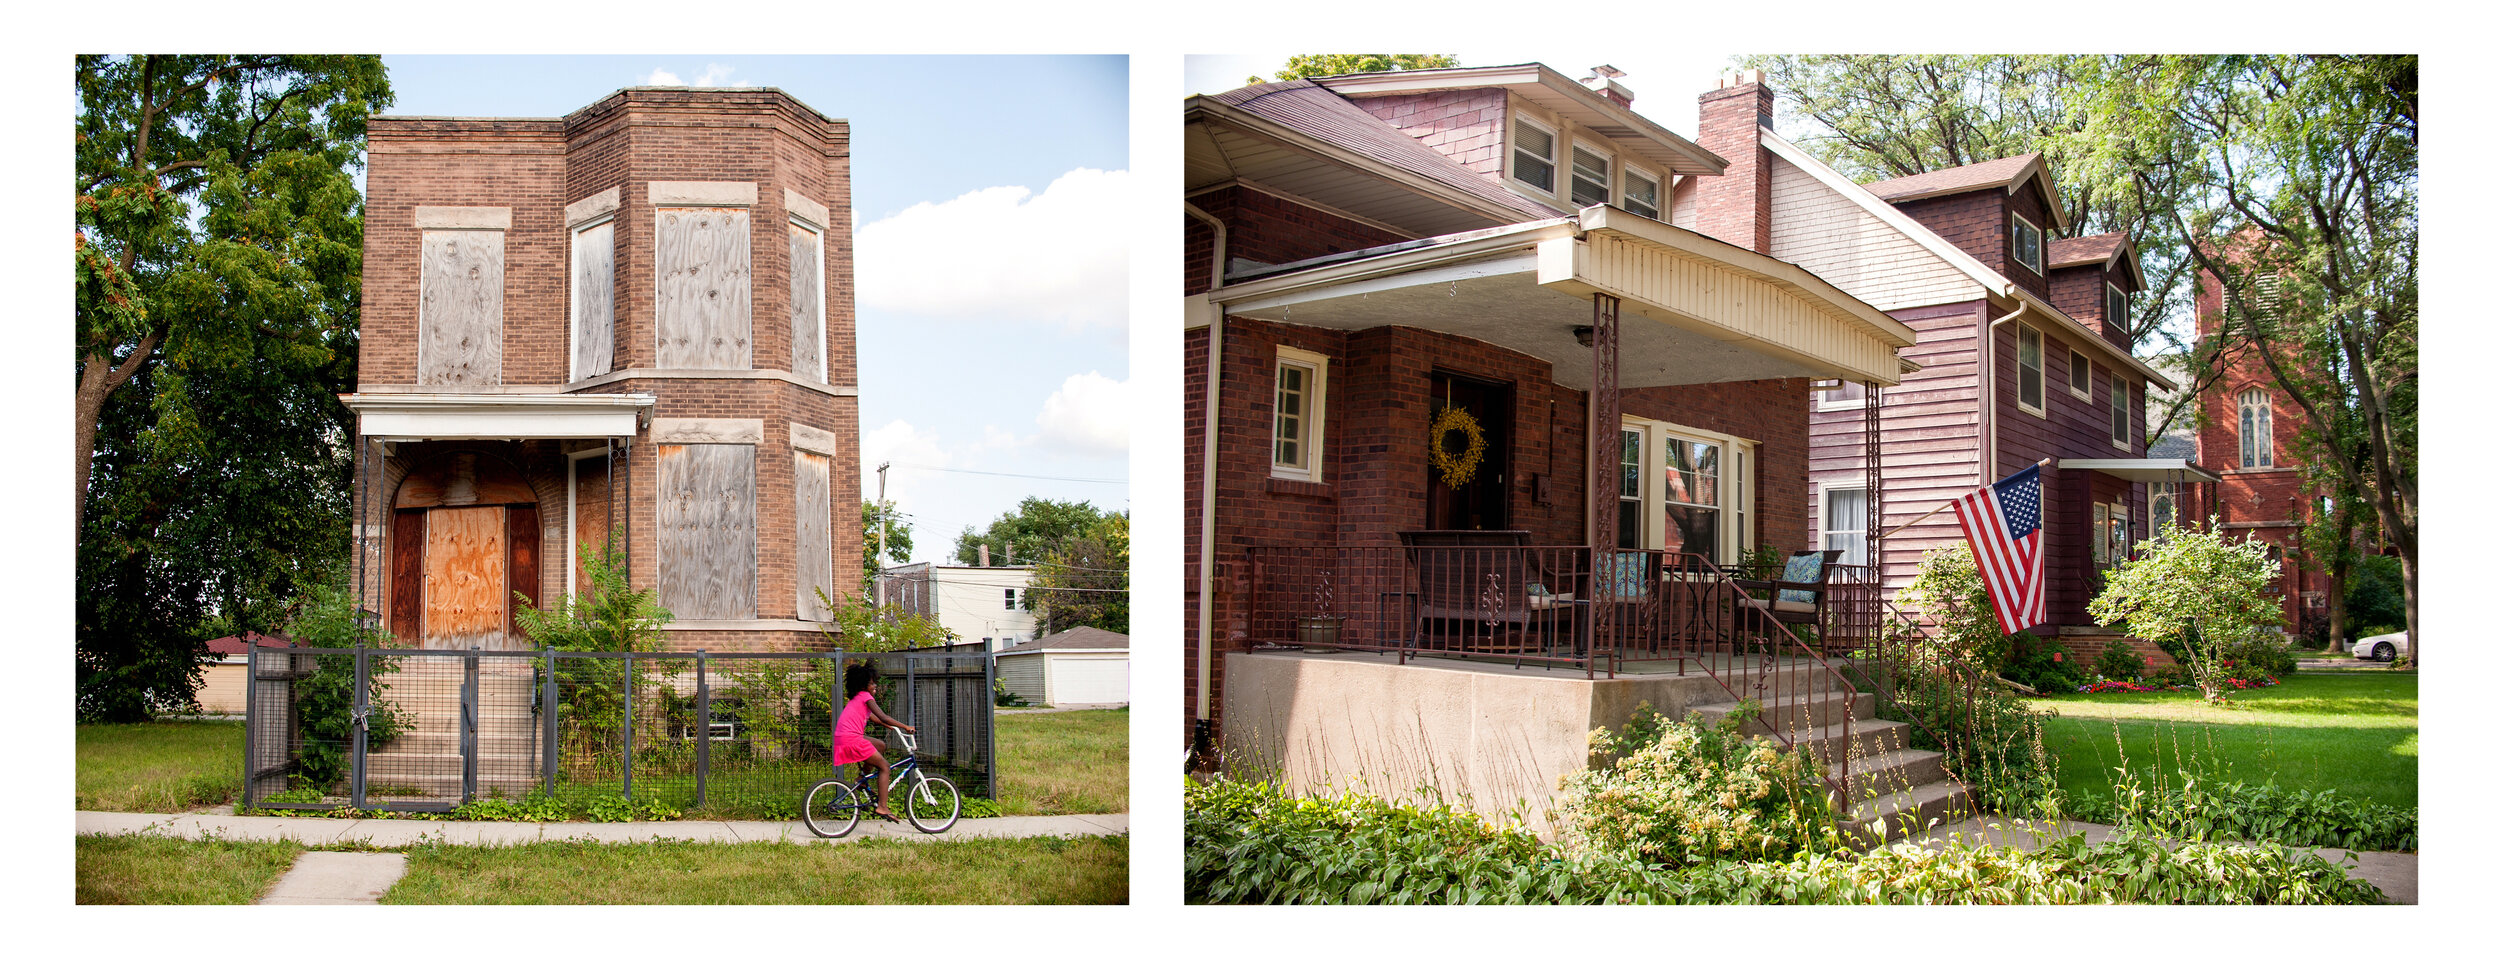
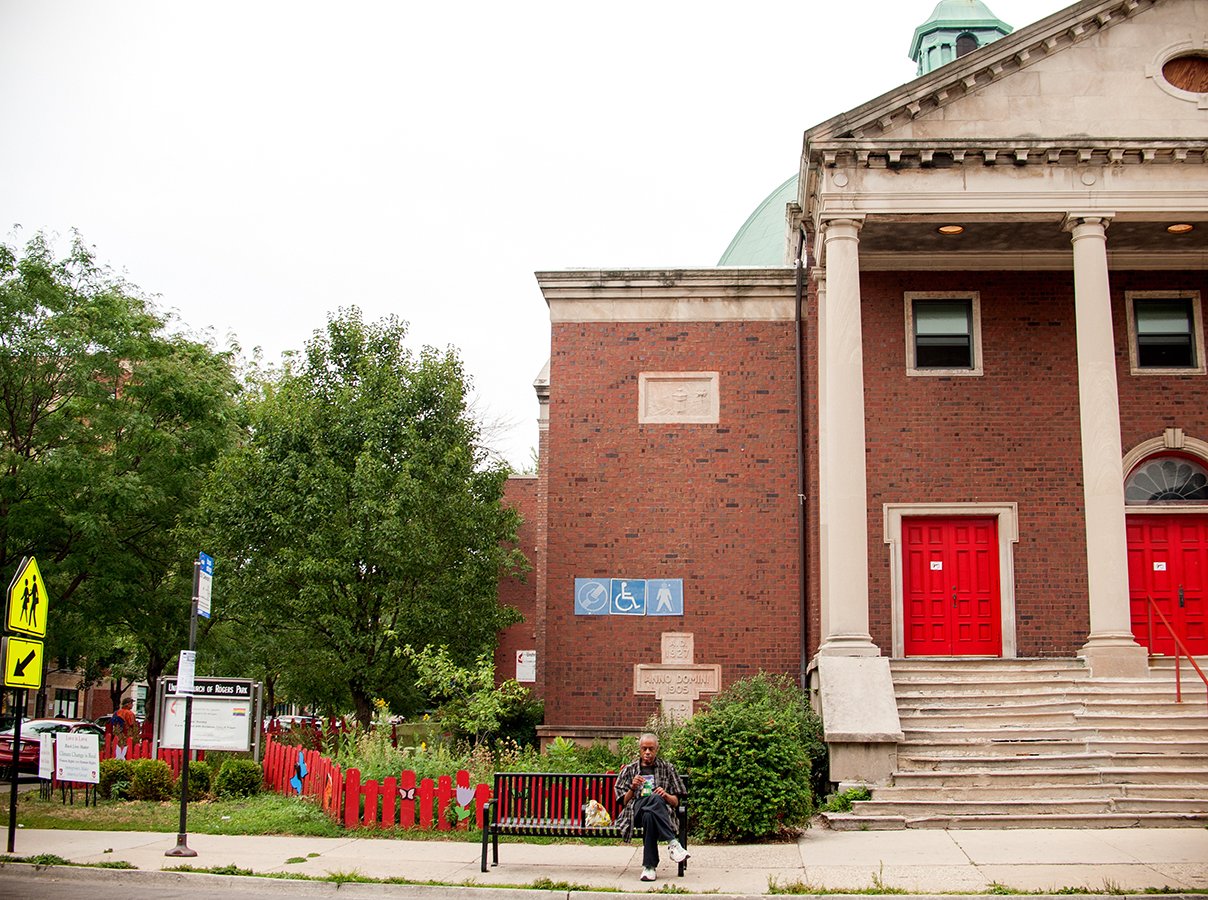
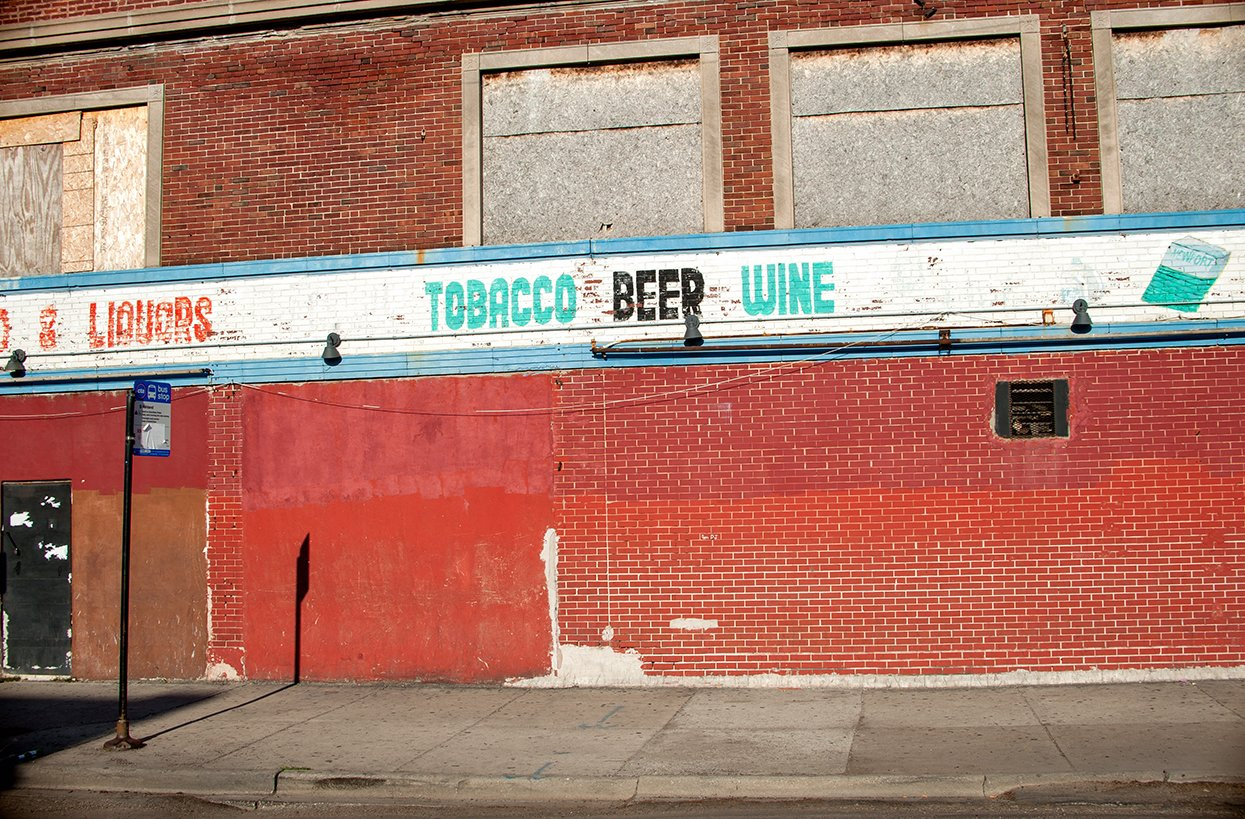
Ask students to spend time closely reading images in the Folded Map Project and consider the following questions:
Look closely at the diptychs (two images presented side-by-side as one art piece). If you knew nothing about this project, what might you assume the relationship between the two images could be?
What do feel you understand about each place depicted in the images? What details in the images make you feel this way?
Why do you think Johnson chooses photography and video as an vehicle to convey the Folded Map Project?
ACTIVISM
What does it mean to be an artist activist?
Artist activists use their creative practice to elevate awareness of social, economic, and cultural issues and to inspire positive social change. You can see examples of some work in the museum’s permanent collection by artists who work in this way here.
After engaging with these works in the collection, as well as Johnson’s images and videos, discuss these questions as a class or in small groups:
What does activism look like to you? Where have you seen activists in action in your communities?
Can art-making be a form of activism? If so, what impact do you think art can have on advancing justice issues?
Is there anything that art can offer to a justice cause that is different from other forms of protest?
What are some other ways to stand up for justice?
POLICY
Why is Chicago so segregated?
During the Great Migration (1915–1970), an estimated six million Black Americans left the South to find better lives in the North and West, with many moving to large US cities due to the promise of industrial jobs and freedom from oppressive Jim Crow laws. Chicago was permanently transformed during this time; its population of Black residents grew from just 2 percent of the overall population in 1910 to 33 percent by 1970.
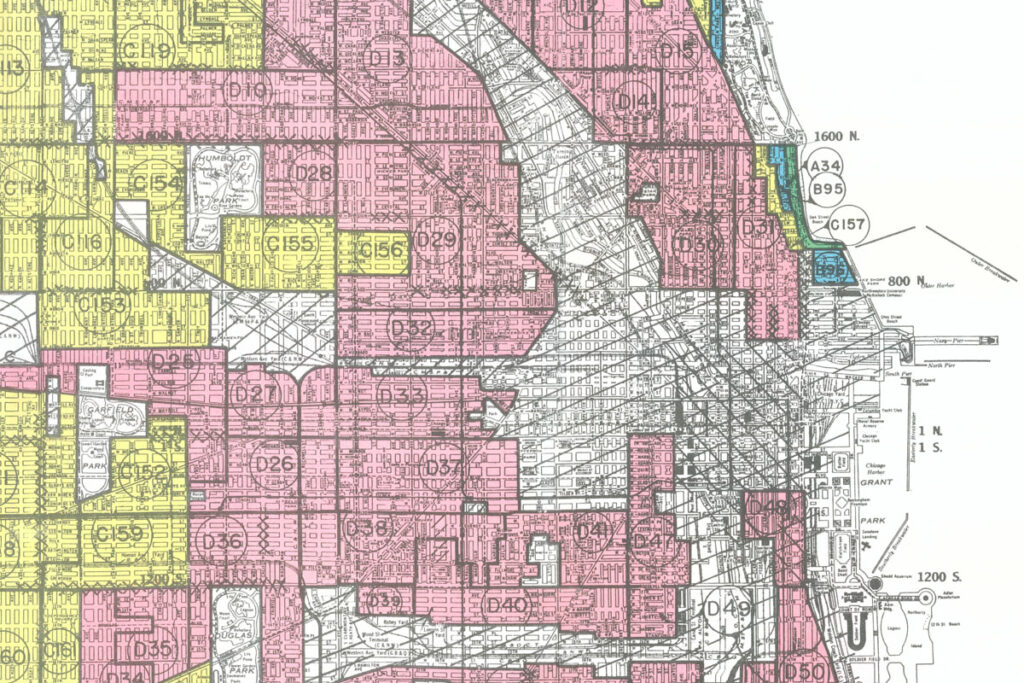
Yet, as soon as Black Americans and families arrived in Chicago, Black residents were limited to living in zones in the South and West sides. Racially restrictive covenants kept homeowners in certain areas from selling to non-white buyers until 1963, when the United States Supreme Court banned the covenants. Banks practiced “redlining,” a process of denying financing for mortgages in black neighborhoods. And some realtors frightened white homeowners into selling their homes at a discounted rate when black families moved to their block, convincing them that their property value had declined. These same realtors would then sell the home to a black family at a profit. This practice, known as “blockbusting,” resulted in many white homeowners moving to the city’s suburbs while keeping black neighborhoods separated and at a disadvantaged distance, fueling the deep racial divide that persists today.
Questions for Looking and Discussion
Do you think your neighborhood has affected your identity or how you see the world and the people in it?
If you live in a different neighborhood from your school, what differences do you notice between the two locations.
How might the history outlined above have an impact on where you live, go to school, shop, or relax?

POWER
Create your own work inspired by the Folded Map Project
Build a map of the perfect neighborhood
Working in groups, have students brainstorm the question: “What would a perfect neighborhood look like?” Push them to think about incorporating practical needs as well as their own shared interests. What types of businesses exist there? How much of the area is built and how much is natural? How are the green and natural spaces used? How close or far away are the houses? Where do people congregate?
Once they have identified the key elements of their perfect neighborhoods, have students create visual maps with photographs illustrating each component. Click here to see interactive maps in the Folded Map Project. To see maps created by students in this program at Prosser Career Academy, please visit the Digital Exhibition here.
Create a video diary of a day in your neighborhood
To best understand how to identify your map twin, it helps to first investigate your own surroundings. Using a video camera or camera phone, create a video journal diary of a day in your neighborhood. What can you access in a one-mile radius from your home? How many grocery stores, convenience stores, parks, schools, or businesses are on this route? What makes your neighborhood different from others in the city?
Compile your segments and pair with audio of your choice. Consider how sound impacts the mood of the piece. Do you want to narrate the imagery or allow viewers to interpret on their own? Will you use music? If so, what type of music conveys the mood of the neighborhood best?
To see video diaries created by students in this program at Kenwood Academy, please visit the Digital Exhibition here.
Make a photographic montage of your neighborhood map twin
Ask students to identify their neighborhood map twin, using the Folded Map Action Kit as a guide. Remind them, as indicated in the action kit, that they are not tourists but community members or residents for the day. While following the prompts in this guide, ask them to photograph places of beauty. After returning back to the classroom, work in groups to edit the images down to one sequence of four while considering these questions:
How do the images collectively tell the story of a place? How does the story change depending on the arrangement of the images? Is it easier to describe a place in images or words?
To see photo montages created by students in this program at Lincoln Park High School, please visit the Digital Exhibition here.
About Tonika Lewis Johnson
Tonika Lewis Johnson is a life-long resident of Chicago’s South Side neighborhood of Englewood. She is co-founder of the Englewood Arts Collective and Resident Association of Greater Englewood, which seeks to reframe the narrative of South Side communities and mobilize people and resources for positive change. In 2017, she was recognized by Chicago Magazine as a Chicagoan of the Year for her photography of Englewood’s everyday beauty. Her Englewood-based photography projects “From the INside,” and “Everyday Rituals,” were exhibited at Rootwork Gallery in Pilsen, the Chicago Cultural Center, the Harold Washington Library Center and at Loyola University’s Museum of Art (LUMA). LUMA also exhibited her Folded Map project in 2018, and an excerpt of the project was also displayed at the Museum of Contemporary Art within “The Long Dream” exhibition. Since 2018, Tonika has transformed Folded Map into an advocacy and policy-influencing tool that invites audiences to open a dialogue about how we are all socially impacted by racial and institutional conditions that segregate Chicago. In 2019, she was named one of Field Foundation’s Leaders for a New Chicago. In 2020, she formalized Folded Map into a nonprofit organization, where she serves as Creative Executive Officer. In 2021, Tonika was selected as the National Public Housing Museum’s 2021 Artist as Instigator. In that role, she worked on her newest project: Inequity for Sale, which highlights the living history of Greater Englewood homes sold on Land Sale Contracts in the 1950s and 60s.